Today, that’s a huge trick that I’ll share with you!
The thing is that I learnt that only yesterday… so I say to myself that I will share that on the blog while it’s still hot in my memory.
I am sure that you will save a ton of time like I did by using this simple function of Excel that is rather unknown to the people who are not full time data analysts.
Let me give you a small example of what I am talking about…
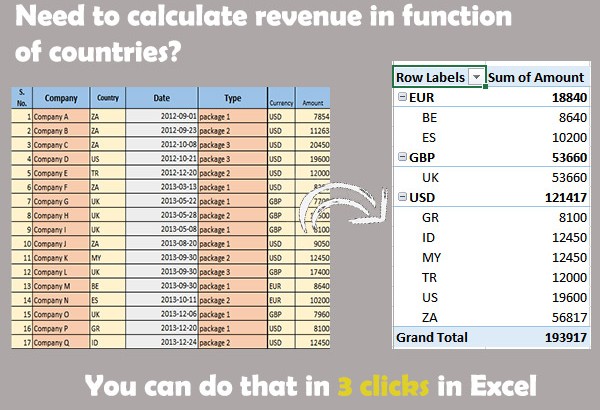
It happens very often that I have to calculate the revenue of different products, in different countries between specific time period.
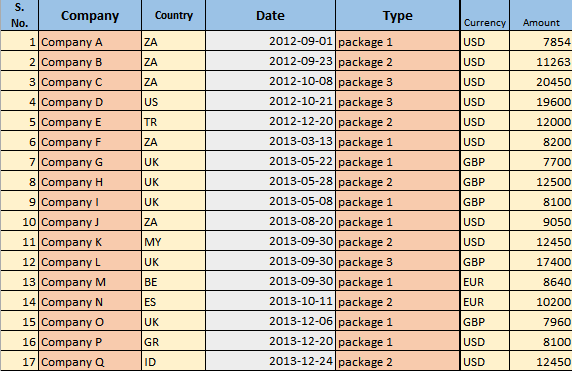
In other words, I get a huge excel table under the form of a list like the following:
What I would like to do is to calculate the revenue of 1st and 2nd half in function of countries for example.
With no real Excel training and knowing only about the basic functions, this kind of calculations can take a lot of time, depending on how you do it…
I don’t even want to tell you here how I was doing that, because now that I think about it, I feel stupid to have lost so much time on something that can be done in almost 1 click.
So here’s the trick:
You have to use something called “pivot table” in Excel to calculate that at light speed
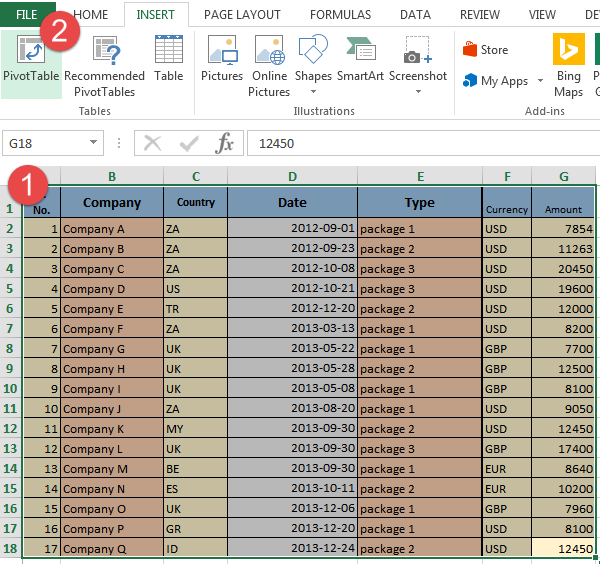
- Select the table and insert the pivot Table
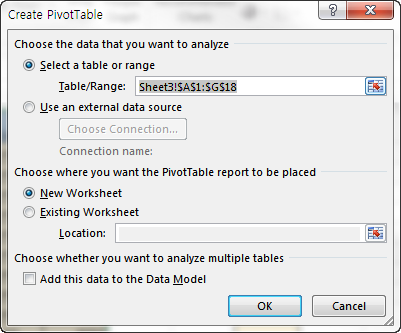
2. In the dialogue box, choose where you want to place the pivot table and click on “OK”
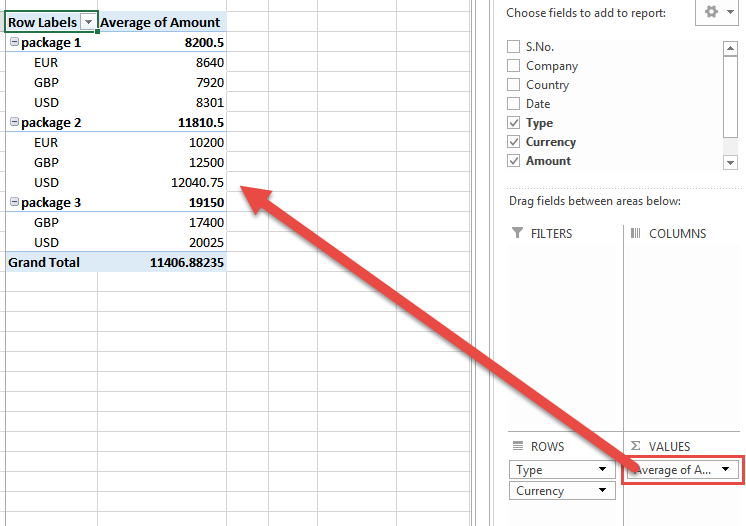
3. In the right par of the screen, you have the fields of your pivot table. Drag and drop those fields in the 4 windows below to create the table you want to see. That’s as simple as that ! (I was blasted to learn that yesterday…)
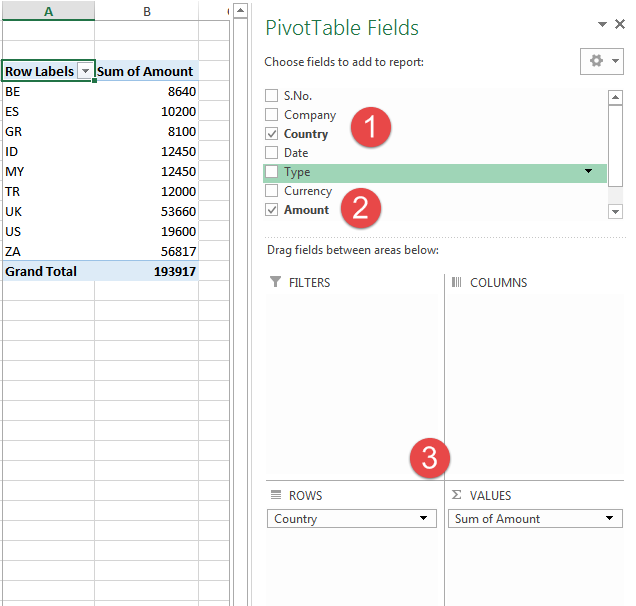
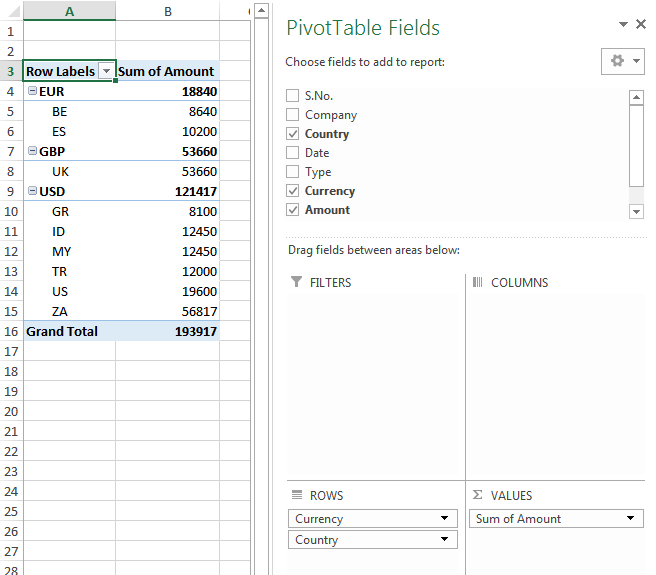
4. Need to add the currency for each country? just check the currency field on the right
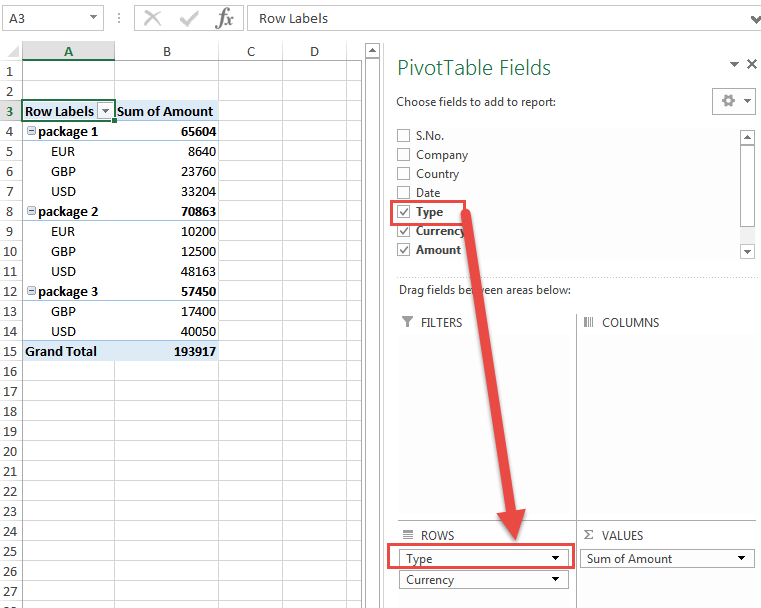
5. Want to view now the revenue for each package ? Unselect country and select “Type” instead.
6. Need to do an average of the revenue for each package, rather than a sum, click on the item on the right and select “Field Value Settings”.
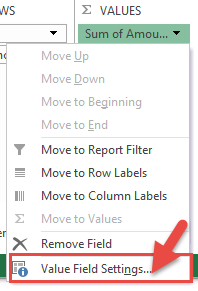
7. Choose “Average” in the window that appears and that’s done!
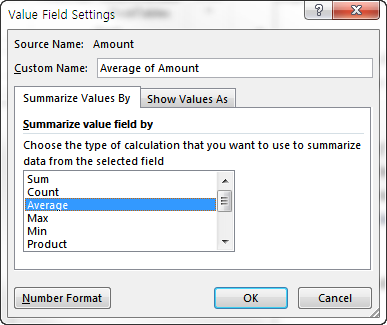
8. Now you see that you get the average of each package
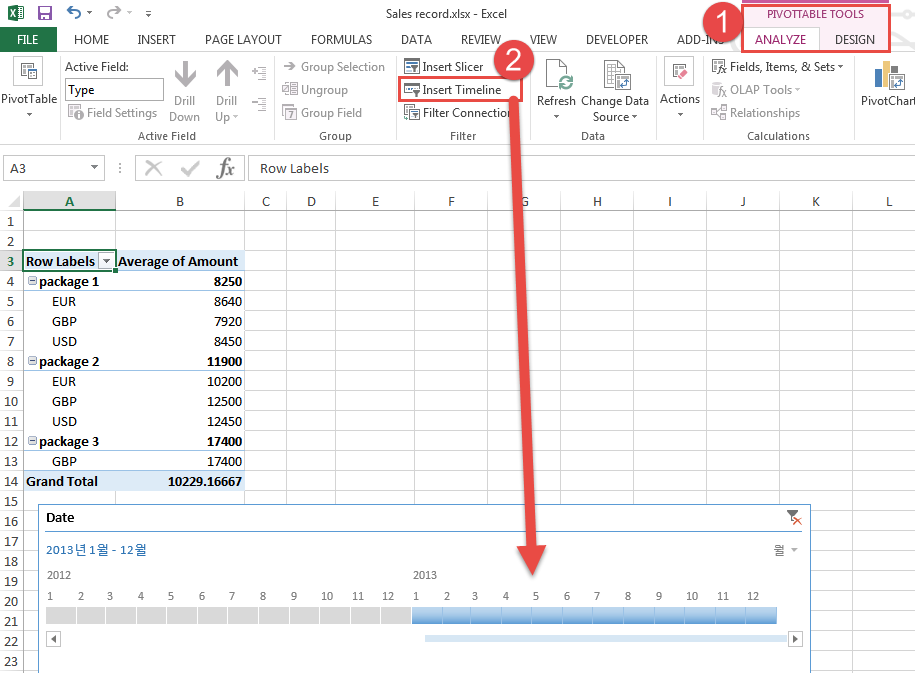
9. Need to restrict the values in the table to certain dates? Insert a timeline Slider and that’s it
OK, that’s it for this post. That was short but I hope that was useful!
If you like this post, please let a comment, that will motivate me to write more such tips and tricks about Excel that I find useful!
–Cyprien
One thought on “How to save hours of stupid work in Excel”